
Cricket matches between the South Africa national cricket team and the India national cricket team have consistently attracted attention from fans across the world. Both sides have a rich cricketing history, experienced international players and different playing styles that make their contests interesting across Test matches, One Day Internationals (ODIs) and Twenty20 Internationals (T20Is). Whether the match takes place in India or South Africa, supporters closely follow every run, wicket, partnership and change in momentum.
The south africa national cricket team vs india national cricket team match scorecard is an important resource for anyone who wants to understand how a match developed. It provides more than the final result because it records individual batting scores, bowling figures, extras, fall of wickets and innings totals. By examining these details, readers can understand which players contributed significantly, how bowlers controlled the scoring rate and which moments influenced the outcome.
This article explains how to read and understand the match scorecard, explores the cricketing rivalry between the two teams and discusses the performances and statistics that make their international encounters memorable.
South Africa vs India Latest Match Scorecard: February 22, 2026
The latest major men’s international meeting between these teams took place on February 22, 2026, during the Super 8 stage of the ICC Men’s T20 World Cup 2026. The match was played at the Narendra Modi Stadium in Ahmedabad, where South Africa delivered a strong performance with both bat and ball. South Africa scored 187 runs for seven wickets in 20 overs, while India were dismissed for 111 runs in 18.5 overs. South Africa won the contest by 76 runs.
The result demonstrated how quickly a T20 match can change when a team combines aggressive batting with disciplined bowling. David Miller played a major role in building South Africa’s total, while India’s batters struggled to establish the partnerships required for a successful chase. The south africa national cricket team vs india national cricket team match scorecard from this contest offers a useful picture of the difference between the two innings.
| Match information | Details |
|---|---|
| Tournament | ICC Men’s T20 World Cup 2026 |
| Stage | Super 8, Group 1 |
| Date | February 22, 2026 |
| Venue | Narendra Modi Stadium, Ahmedabad |
| South Africa | 187/7 (20 overs) |
| India | 111 all out (18.5 overs) |
| Result | South Africa won by 76 runs |
| Player of the Match | David Miller |
| Best individual score | David Miller – 63 runs |
South Africa Innings: Building a Competitive Total
South Africa began their innings with the intention of establishing a strong platform. Although the opening batters could not produce a long partnership, the middle order responded with important contributions. The innings gained momentum through aggressive stroke play, particularly from David Miller and Tristan Stubbs. Their ability to find boundaries and maintain a healthy scoring rate helped South Africa reach a total of 187 runs, giving their bowlers a competitive target to defend.
David Miller was the leading contributor with 63 runs from 35 deliveries. His innings included seven fours and three sixes, demonstrating his ability to combine controlled batting with powerful attacking shots. Tristan Stubbs also remained unbeaten on 44 from 24 balls, providing valuable support during the later overs. Dewald Brevis contributed 45 runs from 29 deliveries, giving the innings additional stability after the early wickets.
South Africa Batting Scorecard
| Batter | Runs | Balls | Fours | Sixes |
|---|---|---|---|---|
| Aiden Markram | 4 | 7 | 0 | 0 |
| Quinton de Kock | 6 | 7 | 1 | 0 |
| Ryan Rickelton | 7 | 7 | 0 | 1 |
| Dewald Brevis | 45 | 29 | 3 | 3 |
| David Miller | 63 | 35 | 7 | 3 |
| Tristan Stubbs | 44* | 24 | 1 | 3 |
| Remaining batters | 18 | — | — | — |
| Total | 187/7 | 20 overs |
The remaining batting contribution includes the other dismissed batter and extras; individual figures should be checked against the official full scorecard.
The partnership between Miller and Stubbs was particularly important because it allowed South Africa to finish their innings strongly. Instead of allowing India’s bowlers to control the final overs, the pair continued attacking and placed pressure on the fielding side. Their contributions turned a competitive start into a challenging total. This batting performance became one of the defining aspects of the match.
Correction and complete batting details: South Africa’s remaining batters were Marco Jansen (2), Corbin Bosch (5) and Kagiso Rabada (0 not out). The team also received 11 extras, bringing the innings total to 187/7.
India Innings: A Difficult Run Chase
India entered the second innings with a target of 188 runs, which required a consistent scoring rate and meaningful partnerships. However, the chase began poorly, with Ishan Kishan dismissed without scoring. Tilak Varma also departed early, putting additional pressure on the middle order. The early wickets affected India’s ability to build momentum, and the team struggled to recover from the difficult start.
Shivam Dube was India’s leading scorer with 42 runs from 37 balls, including one four and three sixes. His innings provided some resistance when wickets were falling at the other end. Suryakumar Yadav contributed 18 runs, while Hardik Pandya scored another 18. However, these contributions were not enough to bring India close to the required target. India eventually finished at 111 all out in 18.5 overs.
India Batting Performance
The following individual contributions explain how India’s innings progressed:
-
Ishan Kishan: 0 runs from 4 balls.
-
Abhishek Sharma: 15 runs from 12 balls.
-
Suryakumar Yadav: 18 runs from 22 balls.
-
Shivam Dube: 42 runs from 37 balls.
-
Hardik Pandya: 18 runs from 17 balls.
Dube’s innings was the most substantial contribution from the Indian batting lineup. His attempt to rebuild the innings demonstrated the importance of partnerships in a T20 chase. Unfortunately, the regular fall of wickets prevented India from establishing the acceleration needed during the final overs.
South Africa Bowling Performance Against India
South Africa’s bowling attack played a central role in defending the target. The bowlers maintained pressure through a combination of pace, accuracy and variations. Marco Jansen was particularly effective, taking four wickets for 22 runs in 3.5 overs. His ability to dismiss important Indian batters prevented the opposition from developing a stable partnership.
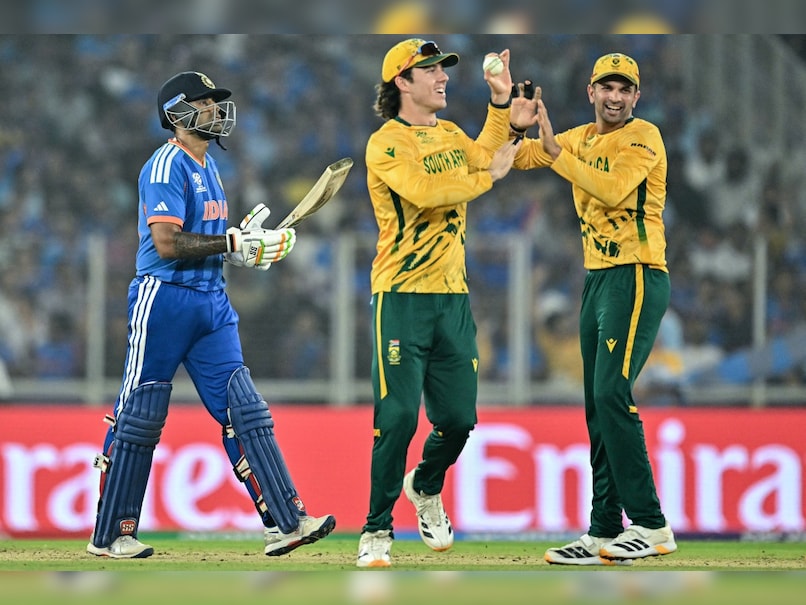
Keshav Maharaj also made a significant contribution by taking three wickets for 24 runs in three overs. Corbin Bosch picked up two wickets while conceding 12 runs in three overs. Aiden Markram contributed one wicket, completing a bowling performance that restricted India to just 111 runs. The bowling figures show that South Africa did not depend on a single player; several members of the attack contributed to the result.
Important Bowling Figures
The most notable performances from South Africa’s bowling lineup were Marco Jansen’s four wickets, Keshav Maharaj’s three wickets and Corbin Bosch’s two wickets. These contributions made it difficult for Indian batters to settle at the crease. Jansen’s four-wicket performance was especially important because he removed key batters at different stages of the chase.
India’s bowling performance also deserves attention. Jasprit Bumrah took three wickets for 15 runs in four overs, while Arshdeep Singh claimed two wickets for 28 runs. Shivam Dube and Varun Chakaravarthy picked up one wicket each. Although India’s bowlers created early opportunities, South Africa’s middle-order batting ensured that the team recovered and posted a competitive total.
Key Turning Points That Decided the Match
Several important moments influenced the direction of this Super 8 encounter. The first major turning point was South Africa’s recovery after losing three early wickets. India had an opportunity to restrict the opposition to a relatively modest total, but the partnership between Dewald Brevis and David Miller changed the situation. Their 97-run partnership provided the foundation for South Africa’s innings and allowed the team to regain control.
The next major moment came when Miller and Stubbs continued scoring quickly. Their contributions ensured that South Africa maintained pressure on the Indian bowlers. During the chase, India’s early wickets created another significant shift. Losing three wickets for 26 runs during the first 4.3 overs made the required target increasingly difficult to achieve. South Africa capitalised on that situation by continuing to attack and taking wickets at regular intervals.
Head-to-Head Rivalry Between India and South Africa
India and South Africa have developed an interesting international cricket rivalry through their encounters in different formats. Their matches often feature a contrast between India’s spin resources and batting depth and South Africa’s pace bowling and athletic fielding. Both teams have produced memorable performances in home and away conditions, making their contests attractive to cricket followers.
Test matches between these nations frequently involve patience, technical batting and the ability to handle fast bowling. In ODIs, the contest often revolves around building partnerships and managing the middle overs before accelerating towards the end. T20 internationals introduce a different challenge because teams must make quick decisions and take calculated risks throughout a short match.
The south africa national cricket team vs india national cricket team match scorecard therefore has value beyond one particular result. Fans can use scorecards from different years and formats to examine batting consistency, bowling effectiveness and the development of individual players. Comparing performances across formats also helps explain why a player who performs exceptionally well in T20 cricket may have a different role in a five-day Test match.
How to Understand a Cricket Match Scorecard
A cricket scorecard contains several statistical details that help readers understand the complete match without watching every delivery. The batting section records the number of runs scored by each player, balls faced, boundaries and strike rate. A batter’s strike rate is particularly important in limited-overs cricket because it indicates how quickly the player scores. For example, a strike rate of 150 means the batter scores approximately 150 runs per 100 deliveries.
The bowling section provides information about overs bowled, maiden overs, runs conceded, wickets taken and economy rate. These statistics help identify bowlers who controlled the scoring rate and those who made important breakthroughs. The fall-of-wickets section records when each batter was dismissed and the team’s total at that moment. Similarly, the partnerships section explains how two batters contributed together. Understanding these details makes the south africa national cricket team vs india national cricket team match scorecard more useful for casual viewers and serious cricket followers.
Important Scorecard Terms Explained
A few common cricket terms make scorecard analysis easier:
-
Overs: The number of completed or partially completed six-ball sets bowled by a team.
-
Strike Rate: The number of runs scored per 100 balls faced by a batter.
-
Economy Rate: The average number of runs conceded by a bowler per over.
-
Extras: Runs awarded through wides, no-balls, byes and leg-byes.
-
Fall of Wickets: The team score and over at which each batter gets dismissed.
These statistics provide a clearer understanding of individual performances and the overall match situation.
Difference Between Test, ODI and T20 Match Scorecards
The format of an international cricket match has a direct influence on how its scorecard should be interpreted. Test cricket allows each team to bat twice, meaning a scorecard can contain four innings. Batting averages, centuries, bowling spells and the number of overs become important indicators of performance. A batter scoring 100 runs in a Test match demonstrates an ability to remain at the crease for an extended period and handle different bowling strategies.
ODI cricket usually consists of 50 overs per team, while T20 international matches have a maximum of 20 overs per side. In ODIs, partnerships and middle-over scoring are particularly important. T20 cricket places greater emphasis on strike rates, boundary percentages and economical bowling. The February 2026 match between India and South Africa illustrates this difference because South Africa scored 187 runs in 20 overs, but India’s batting collapse prevented a successful chase.
Why Fans Follow India vs South Africa Match Statistics
Cricket supporters follow match statistics for several reasons. Some want to check the final result, while others are interested in individual performances, player comparisons and important partnerships. A detailed scorecard helps fans understand whether a team won through strong batting, effective bowling or disciplined fielding. It also provides useful information for people who could not watch the match live.
The south africa national cricket team vs india national cricket team match scorecard is particularly useful for comparing performances between experienced international players and emerging talents. For instance, David Miller’s 63-run contribution and Marco Jansen’s four wickets demonstrate how individual performances can influence a team’s overall success. Similarly, Shivam Dube’s 42 runs show how a batter can contribute even when the rest of the batting lineup struggles.
Statistics also help cricket analysts evaluate team combinations and strategies. Coaches and commentators often examine powerplay performances, middle-over scoring, death-over execution and bowling economy to understand what worked and what needs improvement. These details make a scorecard an important part of modern cricket analysis.
What to Watch in Future India vs South Africa Matches
Future encounters between these teams will continue to attract attention because both sides have players capable of changing a match within a few overs. India’s batting depth and bowling options can create challenging situations for opponents, while South Africa’s fast bowlers and aggressive middle-order batters offer different tactical challenges. The conditions, playing surface, team selection and match format will influence how each contest develops.
Fans following the next south africa national cricket team vs india national cricket team match scorecard should pay particular attention to the opening partnership, powerplay wickets and performances during the final overs. In T20 cricket, a strong start can establish momentum, but an effective bowling spell can quickly change the situation. In longer formats, consistency and patience become more important.
It is also useful to examine how players perform in different conditions. Indian pitches can provide opportunities for spin bowlers, whereas South African conditions often create challenges through pace, bounce and movement. Understanding these differences helps explain why the same team combination may produce different results in different countries.
Conclusion
The India and South Africa cricket rivalry continues to provide exciting international contests across Test, ODI and T20 formats. Their February 22, 2026, T20 World Cup Super 8 meeting was an example of how strong middle-order batting and disciplined bowling can determine the outcome of a match. South Africa posted 187/7 before restricting India to 111 all out, securing a 76-run victory. David Miller’s 63 runs, Tristan Stubbs’ unbeaten 44 and Marco Jansen’s four-wicket performance were among the most important individual contributions.
For cricket followers, the south africa national cricket team vs india national cricket team match scorecard offers a convenient way to explore the result, batting contributions, bowling figures and decisive moments. Looking beyond the final score provides a better understanding of team strategies and individual performances. Whether following a major tournament or a bilateral series, detailed scorecard analysis makes every international cricket contest more informative and enjoyable.

.jpg&description=Explore the South Africa vs India match scorecard, batting performances, bowling figures, partnerships, match highlights and key moments from international cricket.)