
The australian men’s cricket team vs india national cricket team match scorecard is a popular search for supporters who want a clear record of runs, wickets, overs, partnerships, bowling figures, and the final result. However, Australia and India play each other in multiple formats and tournaments, so the scorecard depends on the specific fixture. A Test match scorecard may contain innings totals across several days, while an ODI usually records a maximum of 50 overs per side and a T20I is limited to 20 overs per team. Understanding these differences helps readers interpret the figures accurately.
A useful match report should do more than display numbers. It should explain the significance of important partnerships, the impact of wickets at crucial moments, the effectiveness of the bowling attack, and the tactical choices made by both captains. By combining scorecard details with match context, readers can gain a better understanding of the contest rather than relying only on the final result.
Australian Men’s Cricket Team vs India National Cricket Team Match Scorecard: Latest Context
When searching for the australian men’s cricket team vs india national cricket team match scorecard, it is important to identify the match date and format before examining individual performances. One notable recent senior international encounter was the third ODI between Australia and India, played at the Sydney Cricket Ground on 25 October 2025. India won by nine wickets after Australia were dismissed for 236 in 46.4 overs. India then reached 237 for one in 38.3 overs, completing a comfortable chase.
Rohit Sharma played a central role in India’s successful run chase, scoring 121 runs from 125 balls. His innings combined patience with controlled aggression, helping India recover from the pressure of chasing a target against a competitive Australian bowling attack. The result also demonstrated how an ODI total that initially appears defendable can become vulnerable when the chasing side builds a substantial partnership and preserves wickets.
This match provides a useful example of how the scorecard, batting statistics, bowling figures, and match situation work together. Rather than treating the final score as an isolated number, readers can examine Australia’s innings, India’s response, and the factors that influenced the outcome. These details make a scorecard more informative for cricket enthusiasts, analysts, and readers looking for a reliable match summary.
Match Summary and Scorecard Details
The third ODI at Sydney was part of India’s tour of Australia in October 2025. Australia won the toss and elected to bat, aiming to establish a competitive total on home soil. However, the innings ended at 236 runs after 46.4 overs, leaving India with a target of 237 to win. Australia’s inability to use all 50 overs meant the batting side had fewer opportunities to build a larger total, while India’s bowlers were able to finish the innings before the allotted limit.
India’s reply was considerably more straightforward. The visitors reached 237 for one in 38.3 overs, winning with nine wickets remaining and 11.3 overs unused. Rohit Sharma’s century was the defining batting contribution, and the team needed only one wicket to fall before completing the chase. This difference between the two innings illustrates why the australian men’s cricket team vs india national cricket team match scorecard should be assessed through both totals and the circumstances in which they were achieved.
| Match detail | Information |
|---|---|
| Match | Australia vs India, 3rd ODI |
| Date | 25 October 2025 |
| Venue | Sydney Cricket Ground, Sydney |
| Australia | 236 all out in 46.4 overs |
| India | 237/1 in 38.3 overs |
| Result | India won by 9 wickets |
| Player of the Match | Rohit Sharma |
| Rohit Sharma’s score | 121 runs off 125 balls |
The figures show that India not only reached the target but did so with considerable time remaining. In a limited-overs contest, this matters because it reflects the chasing team’s ability to manage the required run rate without exposing too many batters to risk. Australia’s total was the starting point of the contest, but India’s controlled pursuit ultimately determined the result.
Australia’s Batting Performance
Australia’s innings began with the objective of building a strong foundation and setting a challenging target for India. Batting first in an ODI places particular importance on the opening partnership because early wickets can force the middle order to rebuild rather than accelerate. A stable start generally allows the incoming batters to select their attacking opportunities more carefully, while a series of early dismissals can interrupt the planned scoring rate.
Australia finished on 236 runs, losing all ten wickets in 46.4 overs. Although 236 can be competitive under certain pitch and weather conditions, the innings total left India with a manageable target in this match. The early and middle stages of an innings are particularly important when facing India’s bowling attack because the batting side must balance survival against the need to score consistently. Losing wickets while attempting to increase the scoring rate can prevent a team from reaching the total it originally planned.
The scorecard also helps readers distinguish between a low total caused by slow scoring and one caused by regular dismissals. These are different problems requiring different tactical responses. A side that has wickets in hand can accelerate late in the innings, but a team that has lost most of its recognised batters may have to focus on preserving its remaining resources. Australia’s final total and innings length provide the starting point for understanding how the contest developed.
Why Australia’s Total Mattered
In ODI cricket, a target is not judged only by its numerical value. Pitch conditions, boundaries, outfield speed, bowling resources, and the opposition’s batting strength all influence whether a total is competitive. A score of 236 may create pressure when the surface slows down or when the bowling side has a strong defensive attack. On a surface that allows fluent stroke play, however, the same target can become more achievable.
Against India in Sydney, the final result showed that Australia’s total did not create sufficient pressure. India had the opportunity to approach the chase without taking unnecessary risks, and the remaining wickets provided a safety margin. Australia’s bowlers therefore needed early breakthroughs to make the target more difficult to reach, but the match ultimately moved in India’s favour.
India’s Run Chase and Batting Excellence
India’s chase was built around a strong innings from Rohit Sharma, whose 121 runs from 125 deliveries gave the visitors control of the match. A century in an ODI chase is valuable not simply because it adds runs but because it can reduce pressure on the rest of the batting order. When an experienced batter remains at the crease, the team can adjust its scoring rate according to the required target rather than responding to every dot ball with an aggressive shot.
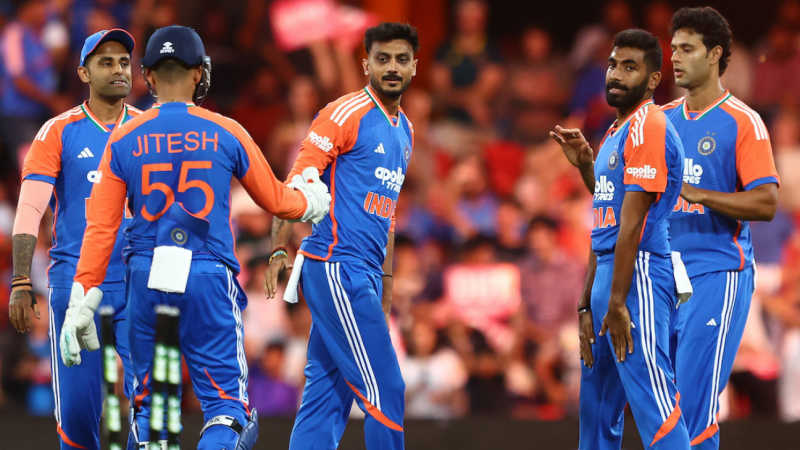
Rohit’s innings demonstrated the importance of timing and decision-making. A successful chase usually involves a mixture of rotating the strike, finding boundaries, and avoiding unnecessary risks against deliveries that deserve respect. The ability to maintain a steady scoring rate while remaining at the crease for a substantial period can force the bowling side to reconsider its plans. As the target becomes closer, the batting team can also choose when to increase the tempo instead of attempting to score rapidly from the beginning.
India reached 237 for one after 38.3 overs, which meant the team had more than 11 overs remaining when the winning total was achieved. This was an efficient performance because the visitors avoided a prolonged finish and preserved nine wickets. For readers analysing the australian men’s cricket team vs india national cricket team match scorecard, the contrast between Australia’s completed innings and India’s successful chase is one of the most important aspects of the result.
Understanding the Significance of a Century
A century carries particular weight in an ODI because it combines consistency with the ability to manage changing match conditions. A batter must judge when to defend, when to rotate the strike, and when to attack gaps in the field. Rohit’s score of 121 was therefore more than a milestone; it was the principal contribution in a chase that required India to score 237 runs.
The number of balls faced is also useful when assessing an innings. Scoring 121 from 125 balls indicates a measured approach rather than an innings based exclusively on rapid hitting. In a chase, such an approach can be effective when the required run rate remains manageable and wickets are available. It allows a batter to maintain control, limit unnecessary risks, and take advantage of scoring opportunities when they appear.
Bowling Analysis and Match-Turning Moments
Bowling figures are essential to a complete scorecard because they reveal how effectively each side controlled scoring and created opportunities for dismissals. The main figures include overs bowled, maidens, runs conceded, and wickets taken. Together, they help explain whether a bowler restricted the opposition through economical bowling, removed key batters, or struggled to contain the scoring rate.
Australia’s bowling unit faced a difficult challenge once India established control of the chase. Defending 236 requires the bowling side to create regular pressure, particularly during the opening overs when the new ball may offer movement. Early wickets can change the tempo of a chase, forcing incoming batters to rebuild and potentially slowing the scoring rate. Without those breakthroughs, a batting side can settle into a rhythm and make the target progressively easier to reach.
India’s bowling performance earlier in the match was equally important. Restricting Australia to 236 all out prevented the hosts from setting a larger target that could have demanded a more aggressive response. Bowling a team out before the end of its allotted overs can also limit the number of late-innings runs, particularly when the batting side has planned to accelerate during the final ten overs.
When reading the australian men’s cricket team vs india national cricket team match scorecard, it is helpful to consider bowling figures alongside the innings timeline. A bowler who takes wickets at important moments may influence the match even without conceding the fewest runs. Similarly, an economical spell can build pressure that leads to wickets at the other end. The best analysis considers the timing and context of each contribution.
Important Factors to Examine in Bowling Figures
-
Overs and economy rate: These figures show how many overs a bowler delivered and how quickly the opposition scored.
-
Wickets taken: Dismissals indicate which bowlers directly removed batters and disrupted partnerships.
-
Runs conceded: The number of runs allowed helps explain whether a bowler controlled the scoring rate.
-
Match situation: A spell during the powerplay may have a different impact from one delivered while defending a small total at the end of an innings.
These details are useful when comparing performances across different matches. A bowler who takes two wickets in the middle overs may have helped break a developing partnership, while a bowler who prevents boundaries in the final overs may have reduced the opposition’s opportunity to accelerate. The match situation gives meaning to the numbers.
How to Read a Cricket Match Scorecard Correctly
A scorecard may look complicated to new cricket fans because it includes abbreviations, individual statistics, extras, and innings totals. Once the basic terms are understood, however, it becomes a practical summary of the entire match. The batting section usually shows the batter’s name, dismissal method, runs scored, balls faced, boundaries, sixes, and strike rate. These figures indicate both the quantity of runs scored and the manner in which the batter accumulated them.
The bowling section generally records overs, maidens, runs conceded, wickets, and economy rate. Extras such as wides, no-balls, byes, and leg-byes are also included in the innings total, although they are not credited to an individual batter. The total combines batter runs and extras, while wickets lost show how many dismissals occurred during the innings. Understanding these distinctions prevents common mistakes when comparing the contributions of individual players.
The australian men’s cricket team vs india national cricket team match scorecard can be easier to interpret when readers follow a consistent order. Start with the final result, then examine the first innings, the most significant batting contributions, and the bowling figures. After that, review the second innings to understand whether the chase was completed comfortably or required a close finish. This approach provides a clear picture without requiring readers to memorise every statistical abbreviation.
The Difference Between Test, ODI, and T20I Scorecards
Australia and India compete in three major formats of men’s international cricket, and each format produces a different kind of scorecard. Understanding the format is important because the same number of runs can have a very different meaning depending on the length of the match, the pitch conditions, and the available overs.
In Test cricket, both teams can bat twice, making the scorecard more detailed. It records each innings separately, and the match may continue for up to five days. Batting averages, partnerships, declarations, follow-on decisions, and the number of overs bowled can all influence the result. A team can win by an innings, by a certain number of runs, or by wickets when chasing a fourth-innings target.
ODIs provide a different challenge because each team normally has a maximum of 50 overs. Teams must balance wicket preservation with scoring acceleration, particularly during the middle and final overs. T20Is place even greater emphasis on rapid scoring, power hitting, economical bowling, and tactical changes within a short period. Readers searching for the australian men’s cricket team vs india national cricket team match scorecard should therefore confirm the format before comparing statistics or judging a performance.
Key Statistics That Help Explain the Result
A scorecard becomes much more informative when individual figures are considered together. Runs scored show a batter’s contribution, while balls faced and strike rate help explain the pace of the innings. Bowling economy indicates how many runs were conceded per over, and the wicket column shows how often a bowler dismissed an opponent. Partnerships also deserve attention because two batters can change the direction of a match through a sustained period at the crease.
Other statistics, including extras, dot balls, boundaries, and the fall of wickets, can reveal why one team gained an advantage. For example, a side that concedes too many wides gives away runs without requiring the batting team to play a scoring shot. Similarly, frequent dot balls may increase the pressure on batters and encourage risky strokes. These smaller details can make a substantial difference when the match is closely contested.
Why Australia vs India Scorecards Attract Attention
The Australia–India rivalry attracts viewers because the teams bring different strengths, experienced players, and a history of important international encounters. Matches between them regularly generate interest in batting records, bowling performances, team selections, and tactical decisions. Supporters also follow individual milestones, such as centuries, five-wicket hauls, and notable partnerships, to understand which players influenced a particular contest.
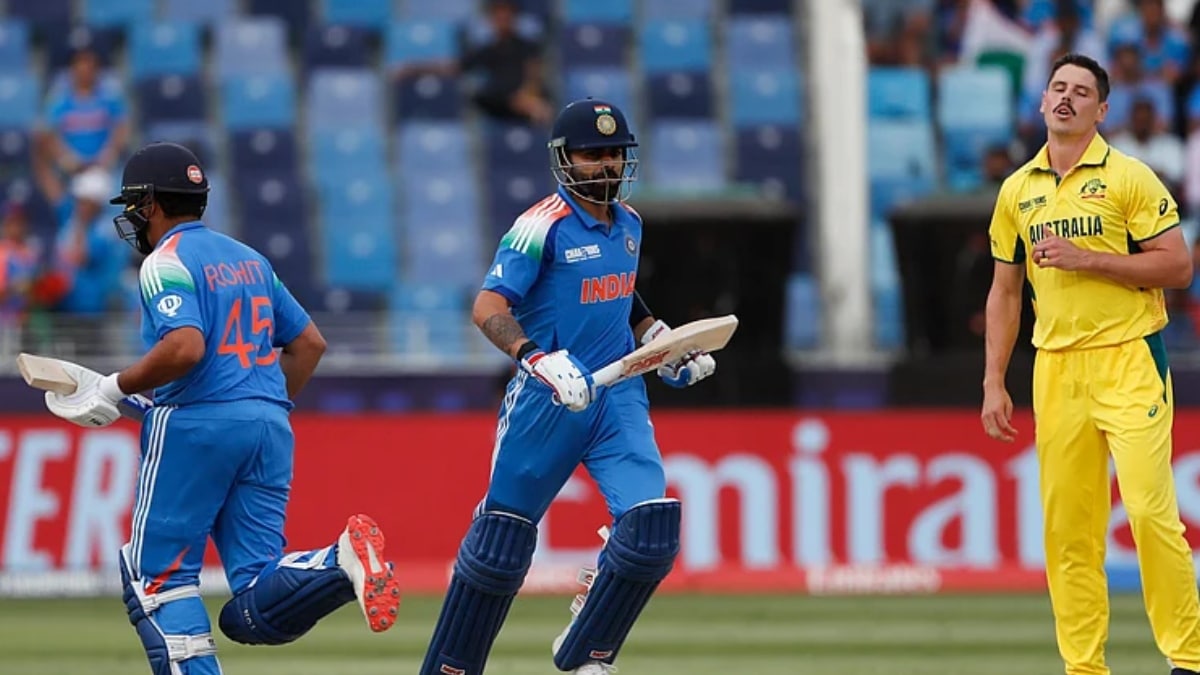
Scorecards are especially useful when fans cannot watch an entire match. A quick review can reveal the winning margin, the highest individual score, the number of wickets taken, and the stage at which the game shifted. However, a scorecard should not be treated as a complete substitute for match context. Weather interruptions, injuries, changes in pitch behaviour, and tactical decisions can all influence how the figures should be interpreted.
For accurate reporting, readers should also distinguish senior international matches from domestic fixtures, practice games, and Australia A or India A encounters. These competitions involve different team selections and levels of representation. Checking the match date, venue, format, and competition helps ensure that the correct result is being discussed.
Conclusion
The australian men’s cricket team vs india national cricket team match scorecard provides a valuable way to understand the numbers behind one of international cricket’s most closely followed rivalries. From the opening partnership to the final wicket, a detailed scorecard captures the runs, dismissals, bowling contributions, and turning points that shape a contest. Reading these statistics alongside the match situation makes it easier to understand not only who won but also how the result was achieved.
The third ODI at Sydney on 25 October 2025 offers a clear example. Australia were dismissed for 236 in 46.4 overs, while India reached 237 for one in 38.3 overs to win by nine wickets. Rohit Sharma’s 121-run innings was central to India’s successful chase, demonstrating how a composed batting performance can turn a target into a manageable task. Ultimately, the best way to analyse any Australia versus India scorecard is to examine the final result, individual performances, partnerships, bowling figures, and match conditions together. Whether following a Test, ODI, or T20I, readers gain a more complete understanding when they look beyond the headline score and consider the events that shaped the game.

