
The Indian Premier League is one of cricket’s most competitive T20 tournaments, where every match can influence a team’s position, playoff chances, and overall campaign. Fans follow team performances throughout the season to understand which franchises are leading, which teams are fighting for qualification, and which sides need a stronger run of results. The points table brings these developments together in one place, making it easier to compare teams and evaluate their progress.
The IPL standings for the 2026 season reflect a closely contested league stage, particularly at the top, where Royal Challengers Bengaluru, Gujarat Titans, and Sunrisers Hyderabad all finished with 18 points. Royal Challengers Bengaluru secured first place because of their superior net run rate, while Rajasthan Royals claimed the fourth playoff position with 16 points. Punjab Kings narrowly missed qualification despite collecting 15 points, demonstrating how important individual results and net run rate can be in a long tournament.
With the league stage now complete, the final table provides a useful picture of each franchise’s consistency, strengths, and weaknesses. Examining the numbers alongside match results helps explain why some teams progressed to the playoffs while others fell short. Understanding the standings also gives cricket followers a clearer view of how points, victories, defeats, abandoned matches, and net run rate shape the competition.
IPL 2026 Final Points Table
The final league-stage table shows that three teams finished level on points at the top, making net run rate the deciding factor in their positions. Royal Challengers Bengaluru topped the standings with 18 points and a net run rate of +0.783. Gujarat Titans finished second with the same number of points, followed by Sunrisers Hyderabad in third place. Rajasthan Royals completed the playoff lineup in fourth position, while Punjab Kings finished fifth after a campaign that included one no-result match.
The IPL standings also highlight the differences between the middle and lower sections of the table. Delhi Capitals finished sixth with 14 points, followed by Kolkata Knight Riders with 13. Chennai Super Kings ended their campaign in eighth place, while Mumbai Indians and Lucknow Super Giants occupied the bottom two positions. The final rankings reveal how consistency across 14 league matches proved essential for teams hoping to reach the knockout stage.
| Position | Team | Played | Won | Lost | Points | Net Run Rate |
|---|---|---|---|---|---|---|
| 1 | Royal Challengers Bengaluru | 14 | 9 | 5 | 18 | +0.783 |
| 2 | Gujarat Titans | 14 | 9 | 5 | 18 | +0.695 |
| 3 | Sunrisers Hyderabad | 14 | 9 | 5 | 18 | +0.524 |
| 4 | Rajasthan Royals | 14 | 8 | 6 | 16 | +0.189 |
| 5 | Punjab Kings | 14 | 7 | 6 | 15 | +0.309 |
| 6 | Delhi Capitals | 14 | 7 | 7 | 14 | -0.651 |
| 7 | Kolkata Knight Riders | 14 | 6 | 7 | 13 | -0.147 |
| 8 | Chennai Super Kings | 14 | 6 | 8 | 12 | -0.345 |
| 9 | Mumbai Indians | 14 | 4 | 10 | 8 | -0.584 |
| 10 | Lucknow Super Giants | 14 | 4 | 10 | 8 | -0.740 |
Note: The table reflects the final 2026 league-stage standings. Teams with one no-result match have 13 completed results, while the other teams played all 14 matches without an abandonment.
Royal Challengers Bengaluru Finish at the Top
Royal Challengers Bengaluru delivered one of the strongest league-stage performances of the 2026 season. Nine victories from 14 matches earned the franchise 18 points, placing it ahead of every other team. Its net run rate of +0.783 was also the highest among the ten franchises. This combination of match wins and a healthy scoring margin gave Bengaluru first place despite three teams finishing with the same points total.
Finishing first is valuable because it rewards consistency and provides a favourable position in the playoff structure. A team that regularly wins matches and maintains a strong net run rate demonstrates its ability to perform across different conditions. Bengaluru’s final position also illustrates why supporters should consider more than the total points when evaluating a team’s campaign. Two franchises can have identical win-loss records but occupy different positions because of the margins in their victories and defeats.
Gujarat Titans and Sunrisers Hyderabad Remain Close Behind
Gujarat Titans Secure Second Position
Gujarat Titans also finished with nine wins, five losses, and 18 points. Their net run rate of +0.695 placed them second, just behind Bengaluru. The difference between the two sides was not the number of matches won but their overall scoring and conceding margins. This is an important detail when interpreting a points table because net run rate becomes particularly influential when several teams have equal points.

Gujarat’s position reflects a strong league campaign in which the team accumulated enough victories to remain among the leading contenders. However, second place rather than first demonstrates that even a successful season can be decided by relatively small statistical differences. In a competition featuring numerous high-scoring matches, every over and every run can contribute to the final ranking.
Sunrisers Hyderabad Complete the Top Three
Sunrisers Hyderabad finished third with 18 points after recording nine victories and five defeats. Their net run rate of +0.524 was positive but lower than those of Bengaluru and Gujarat Titans. Although the three teams shared the same points total, the final ordering separated them into first, second, and third positions.
For Hyderabad, the final table confirmed a successful league stage and a place among the four playoff qualifiers. Their performance also underlined the importance of maintaining momentum throughout the tournament rather than relying on a few outstanding results. In a long T20 league, teams must repeatedly produce competitive performances because a single defeat can affect both their immediate position and their eventual qualification prospects.
Rajasthan Royals Claim the Fourth Playoff Spot
Rajasthan Royals secured fourth place with eight wins, six losses, and 16 points. Their victory over Mumbai Indians in their final league match proved decisive in the race for the last playoff position. With a net run rate of +0.189, Rajasthan finished ahead of the teams below them and completed the group of four franchises progressing to the playoffs.
Their campaign demonstrates why the final few league fixtures can carry enormous pressure. A team may remain within reach of qualification for several weeks, but it must convert that opportunity into victories when the stakes are highest. Rajasthan managed to achieve that objective, while Punjab Kings finished just outside the qualifying positions despite having a positive net run rate and 15 points.
Why Punjab Kings Missed the Playoffs
Punjab Kings ended the league stage in fifth place with seven wins, six losses, one no-result match, and 15 points. Their net run rate of +0.309 was better than Rajasthan Royals’ figure, but they still finished one position below the playoff cutoff. The difference came down to the points accumulated over the campaign, demonstrating that a strong net run rate cannot automatically compensate for fewer points.
The abandoned match was another important factor. Under the standard IPL points system, each team receives two points for a victory, no points for a defeat, and one point when a match ends without a result. Punjab’s final total illustrates how even a team with a competitive win-loss record can miss the playoffs when other contenders collect more points. Their fifth-place finish was therefore a reminder that qualification depends on the complete league campaign rather than one particular statistic.
Understanding How IPL Standings Work
The points table is designed to rank all participating teams according to their results. During the league stage, every franchise plays a scheduled series of matches, and its position changes as wins, losses, and no-results accumulate. The IPL standings are therefore updated throughout the season rather than determined by reputation, previous titles, or the quality of individual players alone.
A team that wins consistently generally moves towards the top, while repeated defeats make qualification increasingly difficult. However, points are only one part of the ranking system. Net run rate can determine the order when teams are level on points, making the table a combination of results and overall performance.
Key Rules Behind the Points Table
The standard points system is straightforward, although its effect on qualification can become complicated late in the season.
-
Win: A team receives two points for winning a match.
-
Loss: A team receives zero points for a defeat.
-
No result: Each team receives one point when a match is abandoned without a result.
-
Net run rate: This statistic helps separate teams that finish level on points.
These rules explain why teams must pay attention to both their own results and those of their competitors. A victory can increase a team’s points total, but the size of the winning margin may also influence its net run rate. Similarly, a narrow defeat can have a different statistical effect from a heavy loss.
What Is Net Run Rate and Why Does It Matter?
Net run rate, commonly abbreviated as NRR, measures the difference between a team’s average scoring rate and the average rate at which its opponents score against it. It provides a broader view of performance than the number of wins alone. A positive figure indicates that the team has generally scored at a faster rate than its opponents, while a negative figure indicates the opposite across the relevant matches.
For example, imagine two teams that finish a season with eight wins and six losses. If the first team wins several matches comfortably and loses narrowly in others, it may finish with a stronger net run rate. The second team might have the same number of victories but suffer several heavy defeats, leaving it with a lower figure. If both teams have equal points, the higher net run rate can determine which one finishes above the other.
This explains the difference between Bengaluru, Gujarat Titans, and Hyderabad in the final 2026 table. All three finished on 18 points, but Bengaluru’s superior net run rate earned it first place. Net run rate is calculated using runs scored and overs faced compared with runs conceded and overs bowled, subject to the competition’s calculation rules. It is not simply the difference between total runs scored and total runs conceded.
Delhi Capitals, Kolkata Knight Riders and Chennai Super Kings
Delhi Capitals finished sixth with 14 points, recording seven wins and seven losses. Their balanced win-loss record placed them in the middle of the table, but their net run rate of -0.651 reflected the impact of their overall scoring margins. The season demonstrated how alternating wins and defeats can prevent a team from building the consistency needed to compete for a top-four position.
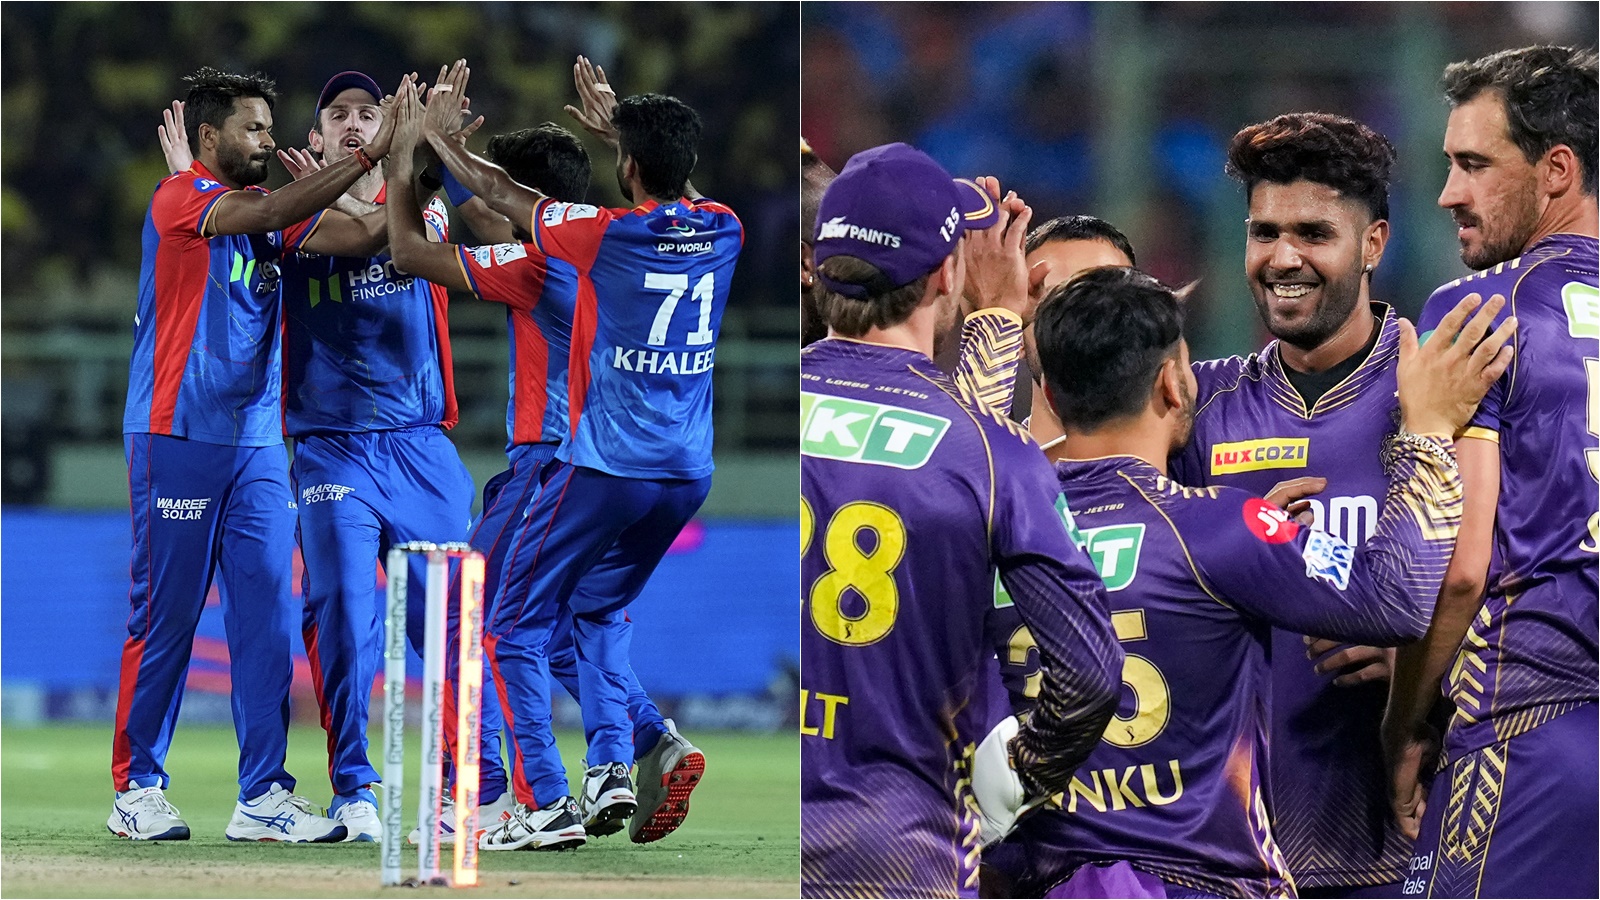
Kolkata Knight Riders finished seventh with 13 points after six wins, seven losses, and one no-result match. Chennai Super Kings followed in eighth place with 12 points, six wins, and eight defeats. For both franchises, the final rankings highlighted the cost of dropping too many matches during the league stage. While individual performances can provide memorable moments, a successful T20 campaign ultimately requires the entire squad to produce results over an extended period.
Mumbai Indians and Lucknow Super Giants Finish at the Bottom
Mumbai Indians and Lucknow Super Giants each recorded four victories and ten defeats, collecting eight points from their 14 matches. Mumbai finished ninth with a net run rate of -0.584, while Lucknow ended tenth at -0.740. The difference between their net run rates determined their relative positions, even though both teams had identical points and win-loss records.
For Mumbai, the campaign fell short of the consistency required to challenge for the playoffs. Lucknow also struggled to collect enough victories, leaving the franchise at the bottom of the table. Their results demonstrate how quickly a team’s position can deteriorate when losses become frequent. Once a side falls behind in the standings, it needs an extended winning run to recover, particularly when its rivals continue accumulating points.
How Fans Can Read the Standings More Effectively
Following a points table becomes more useful when supporters understand what each column reveals. Rather than looking only at a team’s position, readers can compare its matches played, wins, losses, points, and net run rate. This approach helps explain whether a franchise is leading because of consistent victories, benefiting from a no-result match, or separated from another team by a narrow statistical margin.
When reviewing the final IPL standings, fans should also distinguish between league-stage rankings and playoff outcomes. The team finishing first does not automatically win the tournament, because the knockout phase introduces additional matches that determine the champion. A strong league campaign can create a favourable route through the playoffs, but teams must still perform under pressure to secure the title.
For readers comparing teams, the most useful factors are:
-
Points accumulated across the league stage.
-
Number of victories and defeats.
-
Net run rate when teams are level on points.
-
Results in the final matches before qualification is decided.
Considering these factors together provides a more complete picture of each team’s campaign than relying on a single ranking.
Conclusion
The 2026 season produced a competitive final league table, with Royal Challengers Bengaluru taking first place on 18 points, followed by Gujarat Titans and Sunrisers Hyderabad. Rajasthan Royals completed the playoff lineup in fourth position, while Punjab Kings narrowly missed qualification. Further down the table, Delhi Capitals, Kolkata Knight Riders, and Chennai Super Kings occupied the middle positions, while Mumbai Indians and Lucknow Super Giants struggled to keep pace with their competitors. The final IPL standings show that successful campaigns depend on more than individual brilliance or isolated victories. Teams need consistent results, effective squad performances, and the ability to manage difficult matches throughout the season. Net run rate can become the deciding factor when points are equal, while abandoned matches and late-season victories can influence the qualification race. For cricket fans, understanding these details makes the points table far more informative and provides a clearer perspective on how each franchise performed during the 2026 Indian Premier League.

